

HSH maps and graphs is an ongoing index of interactive maps, graphs and transparency records related to San Francisco HSH supportive housing, shelters, DPH sites, public-safety calls and related datasets.
Newest work is listed first within each topic. Older versions are retained where they document the development of a map or dataset.
Start here
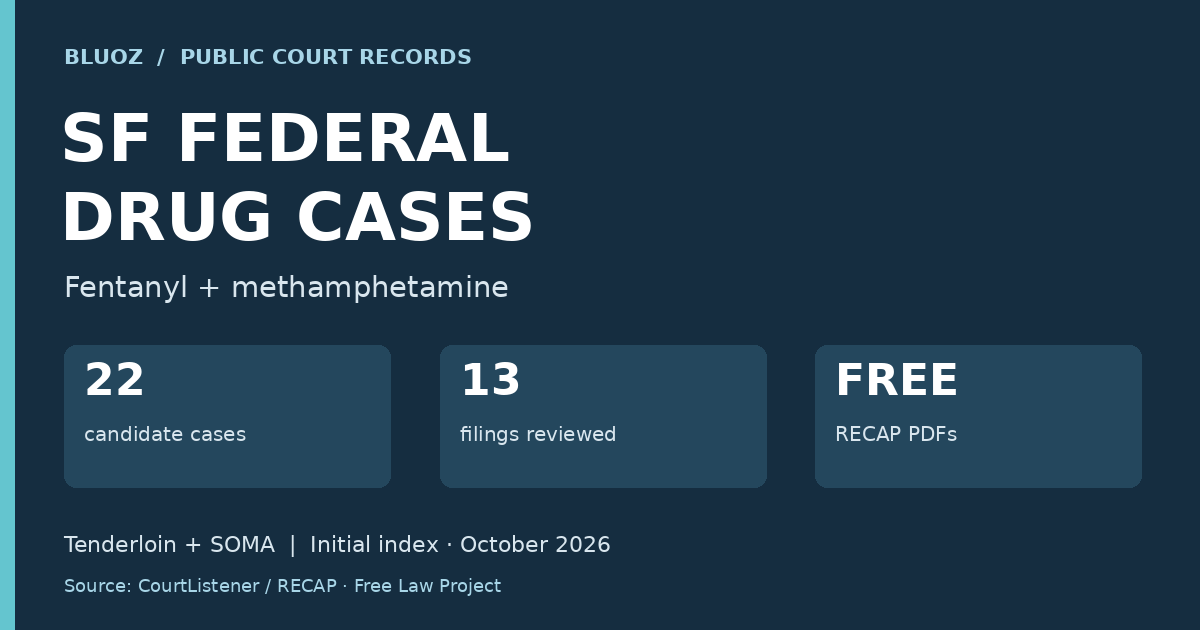
| 22 selected federal drug cases centered on the Tenderloin in San Francisco
10.25.26 <22 selected federal drug cases centered on the Tenderloin in San Francisco/p>
|
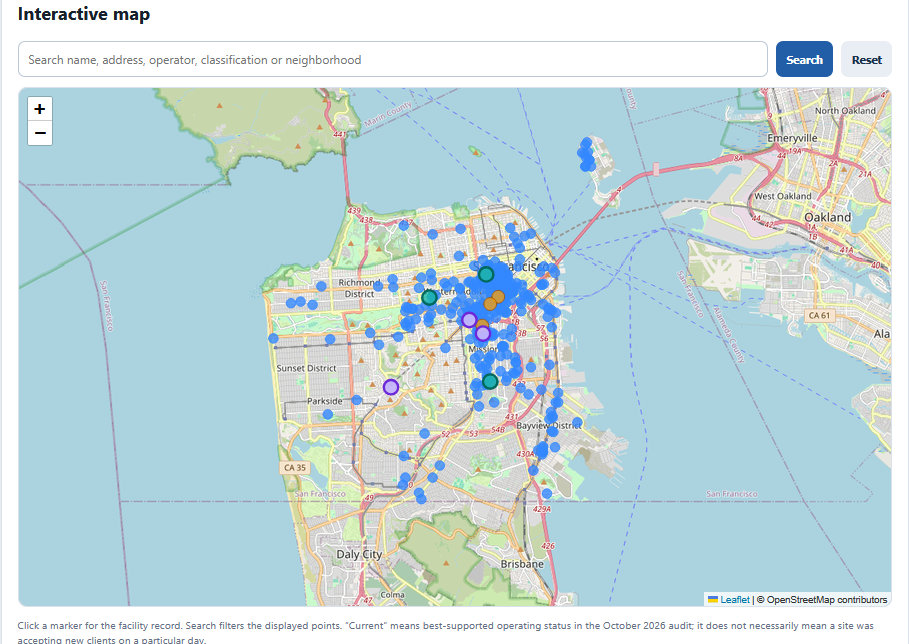
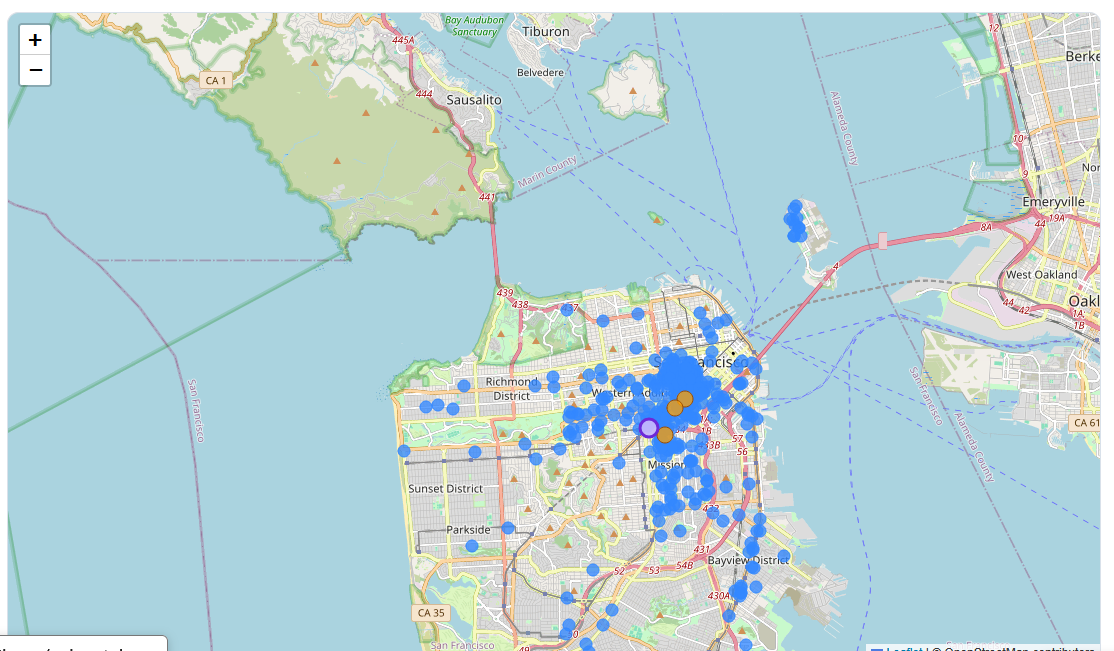
| NEW 418 HSH/DPH property map
10.23.26 New 418 property map supersedes previous 413 property map
|
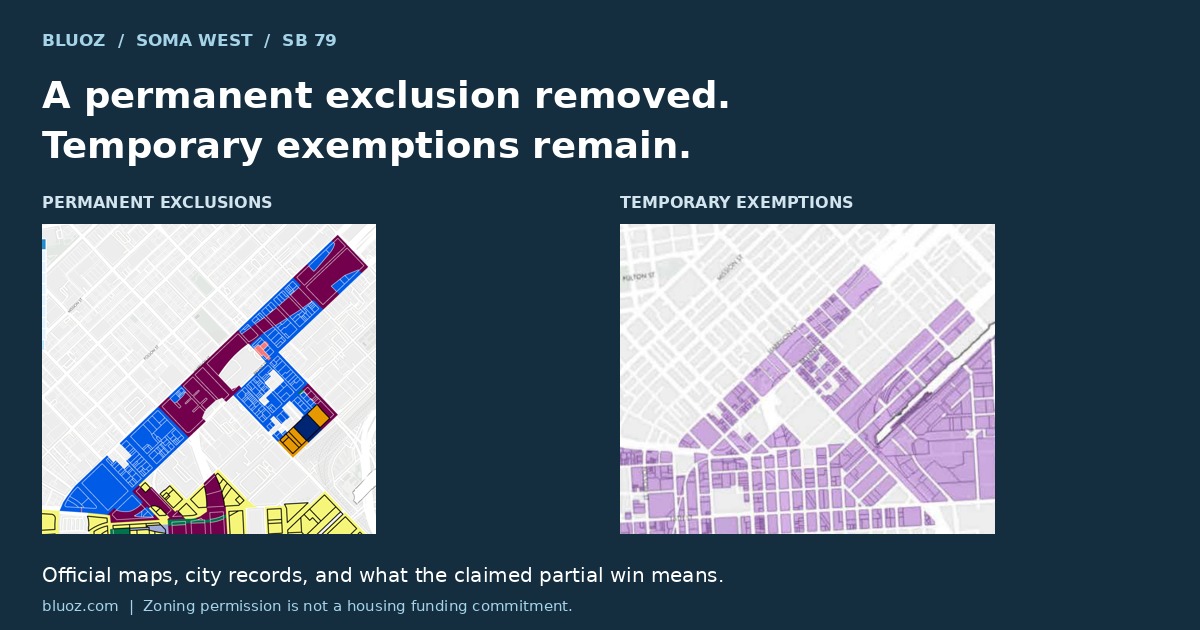
| SOMA West partial win
10.23.26 What city records establish about SOMA West’s reported partial housing victory—and what the maps do not tell us about future housing or service concentration.
|
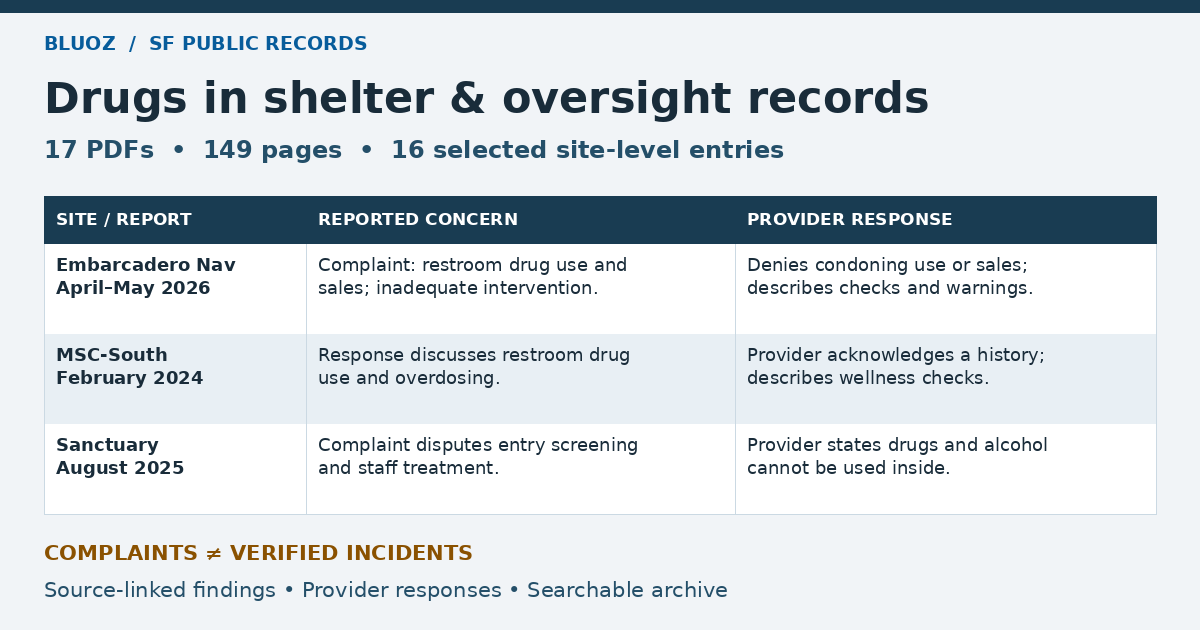
| Drug-related references in SF shelter and oversight records
10.22.26 Selected complaints, provider responses and policy discussions located in public city records. Review expanded October 22, 2026. This archive covers selected records from 2023–2026, plus an archival Health Commission reference.
|
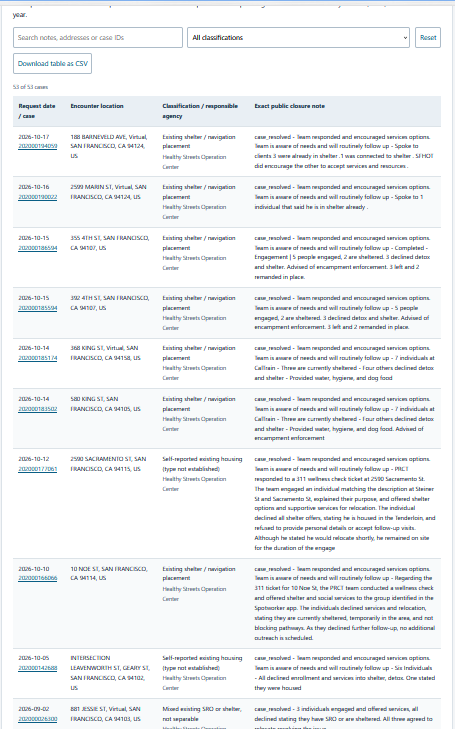
| SF311 field notes already sheltered
10.21.26 extraction of SF311 data with field notes indicating encampment has people already sheltered
|
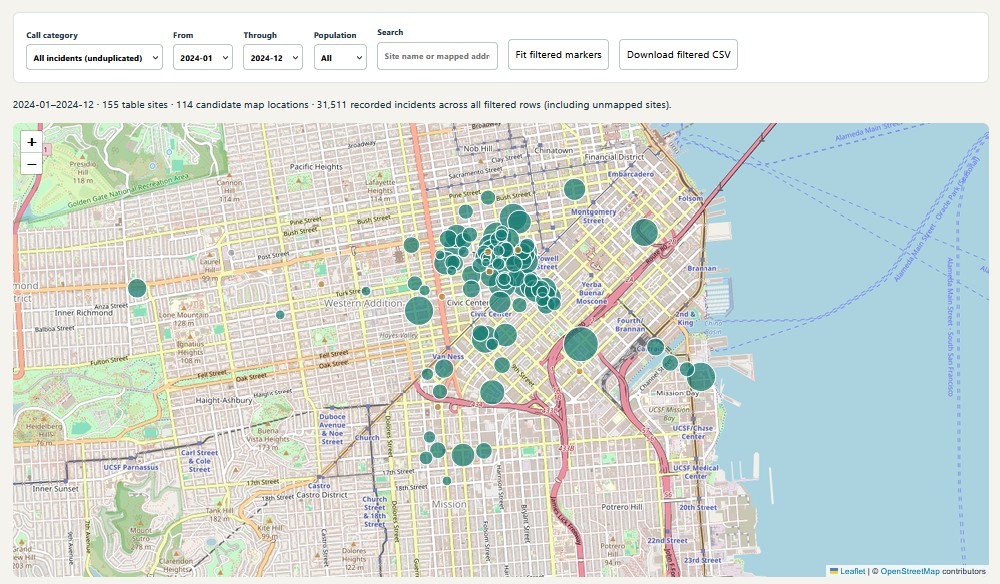
| NEW map 2020-2025 SFDEM 911 calls from the below Dorsey request
10.18.26 NEW map 2020-2025 SFDEM 911 calls from the below Dorsey request
|
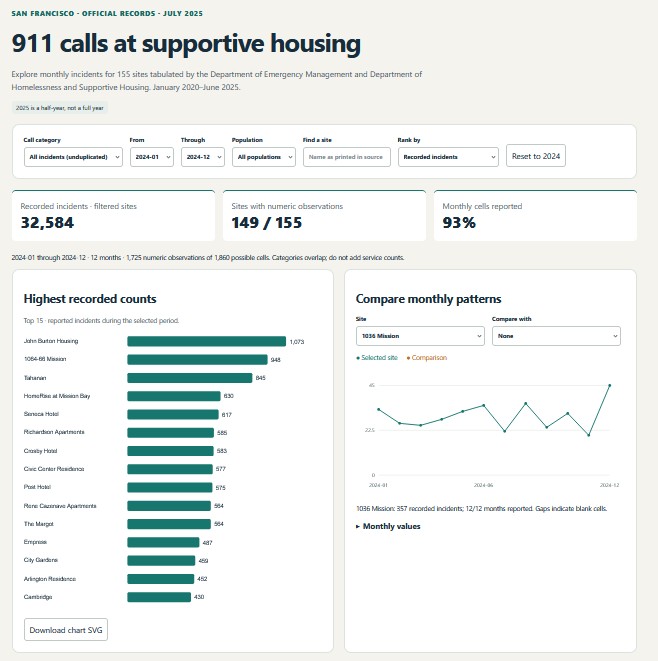
| 911 calls at supportive housing 2020-2025
10.18.26 911 calls at supportive housing requested by supervisor Matt Dorsey 2020-2025
|
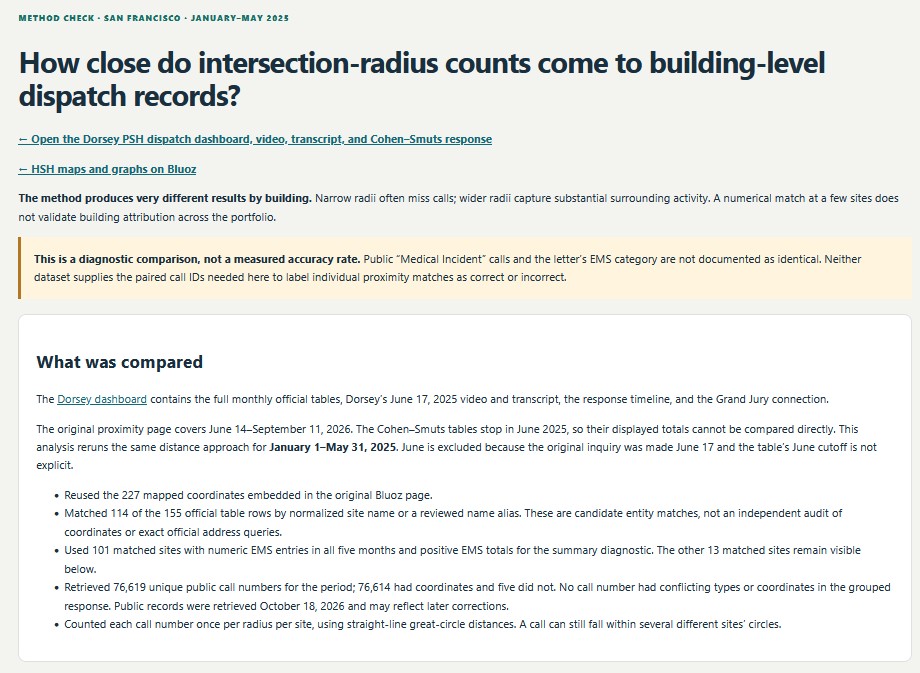
| How close do intersection-radius counts come to building-level dispatch records?
10.18.26 How close do intersection-radius counts come to building-level dispatch records?
|
| New update map 10.16.26 with extensive pop up liner notes, 413 properties
10.16.26 New update map 10.16.26 with extensive pop up liner notes, 413 properties
|
| Trauma Informed San Francisco – a chronology
10.6.26 Trauma informed San Francisco, a chronology. |
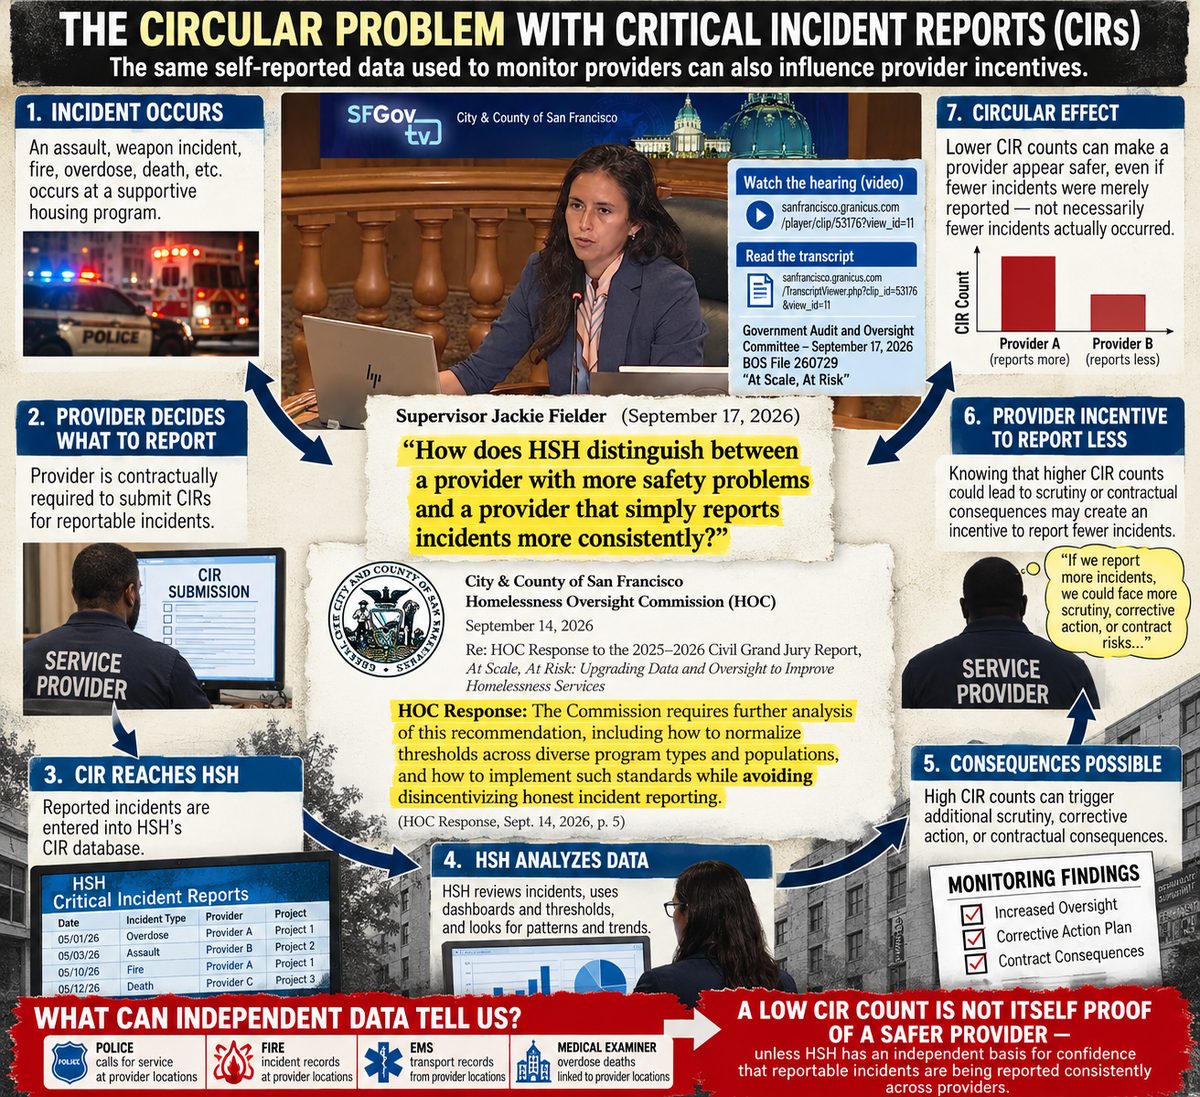
| HSH critical incident reports chronology 2018-2016
10.6.26 HSH critical incident chronology 2018-2026 alternate link https://www.bluoz.com/hsh-cir.html
|
|
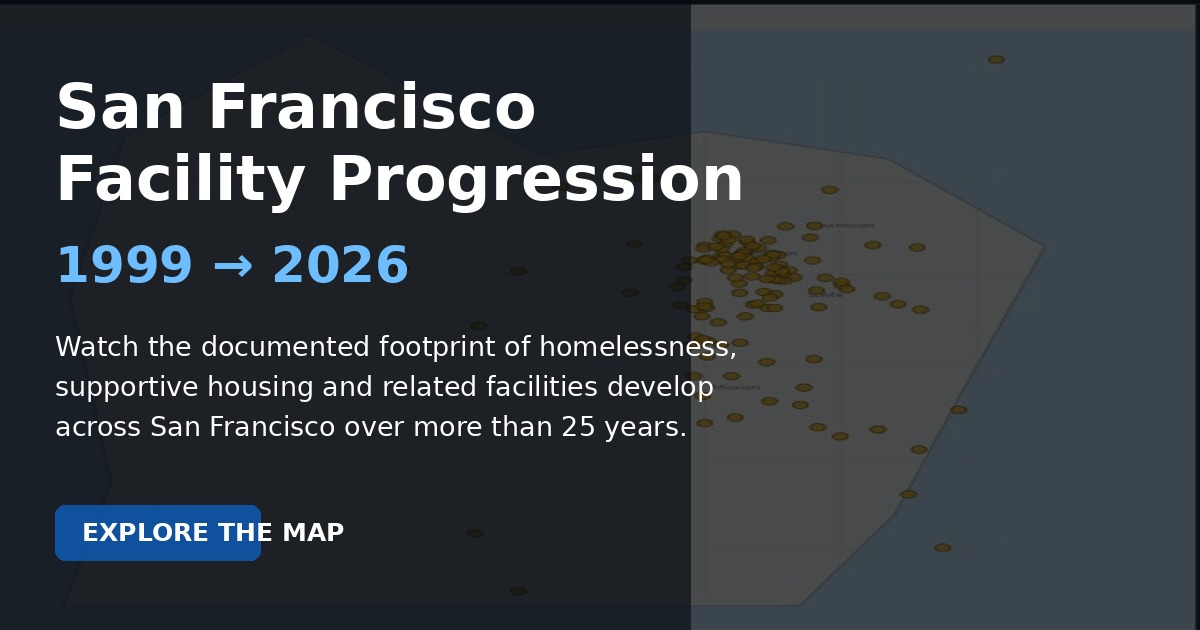
10.3.26 animated HSH non profit expansion map 1999-2026
|
|
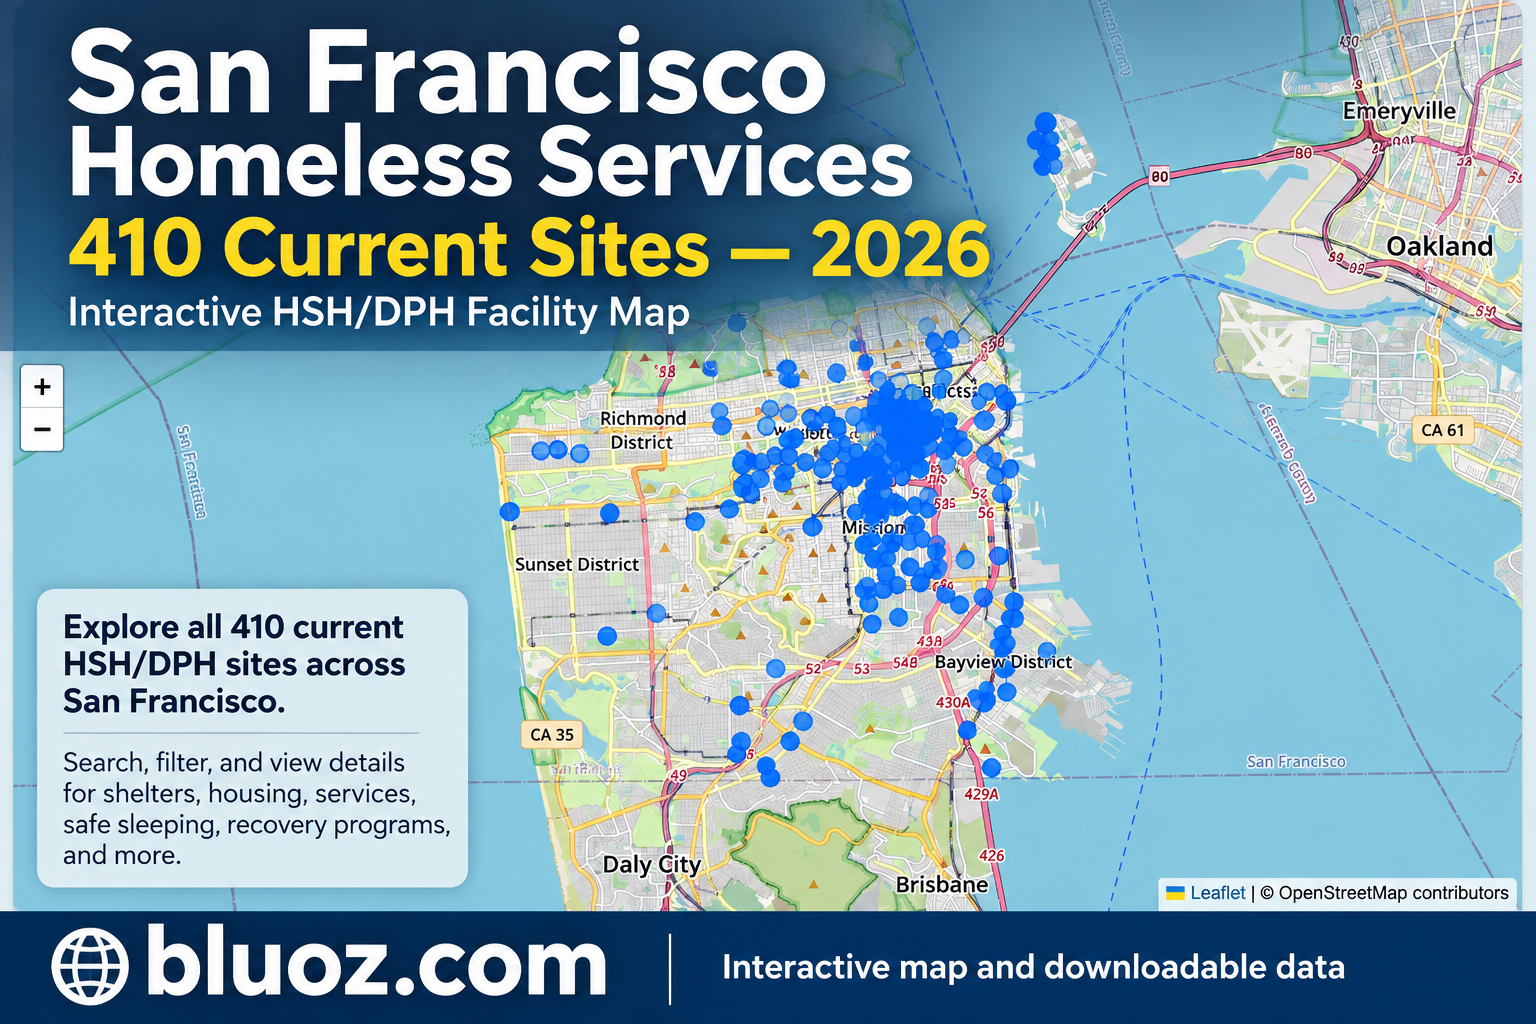
10.2.26 updated map of all currently active DHP/HSH sites in the 2026 portfolio
|
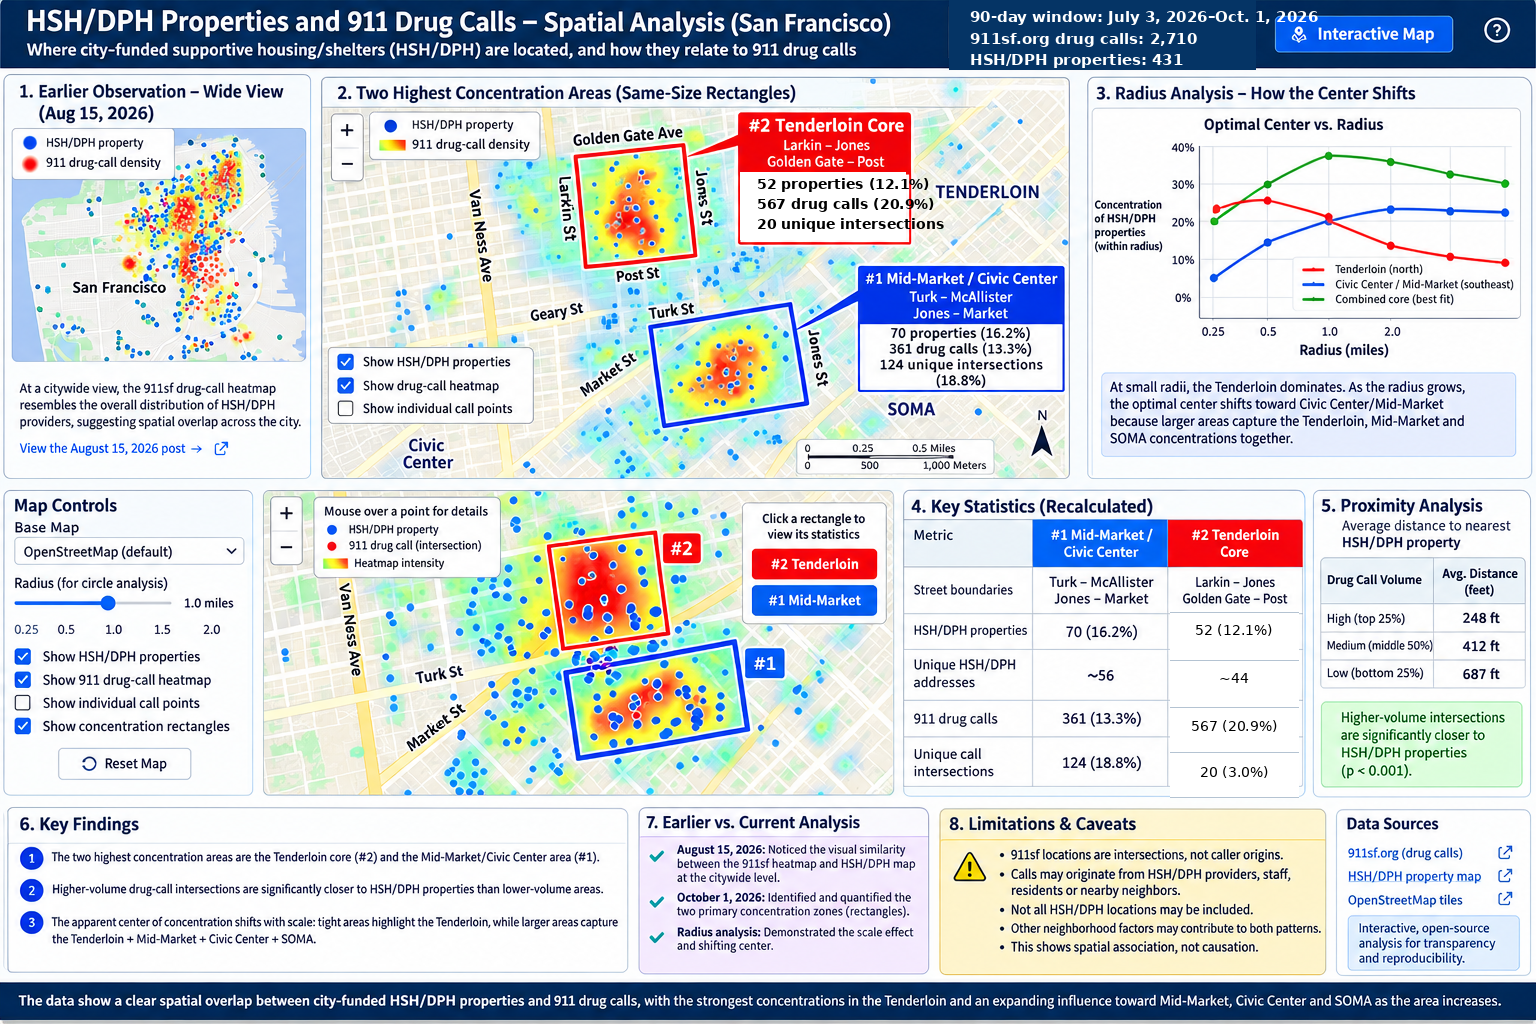
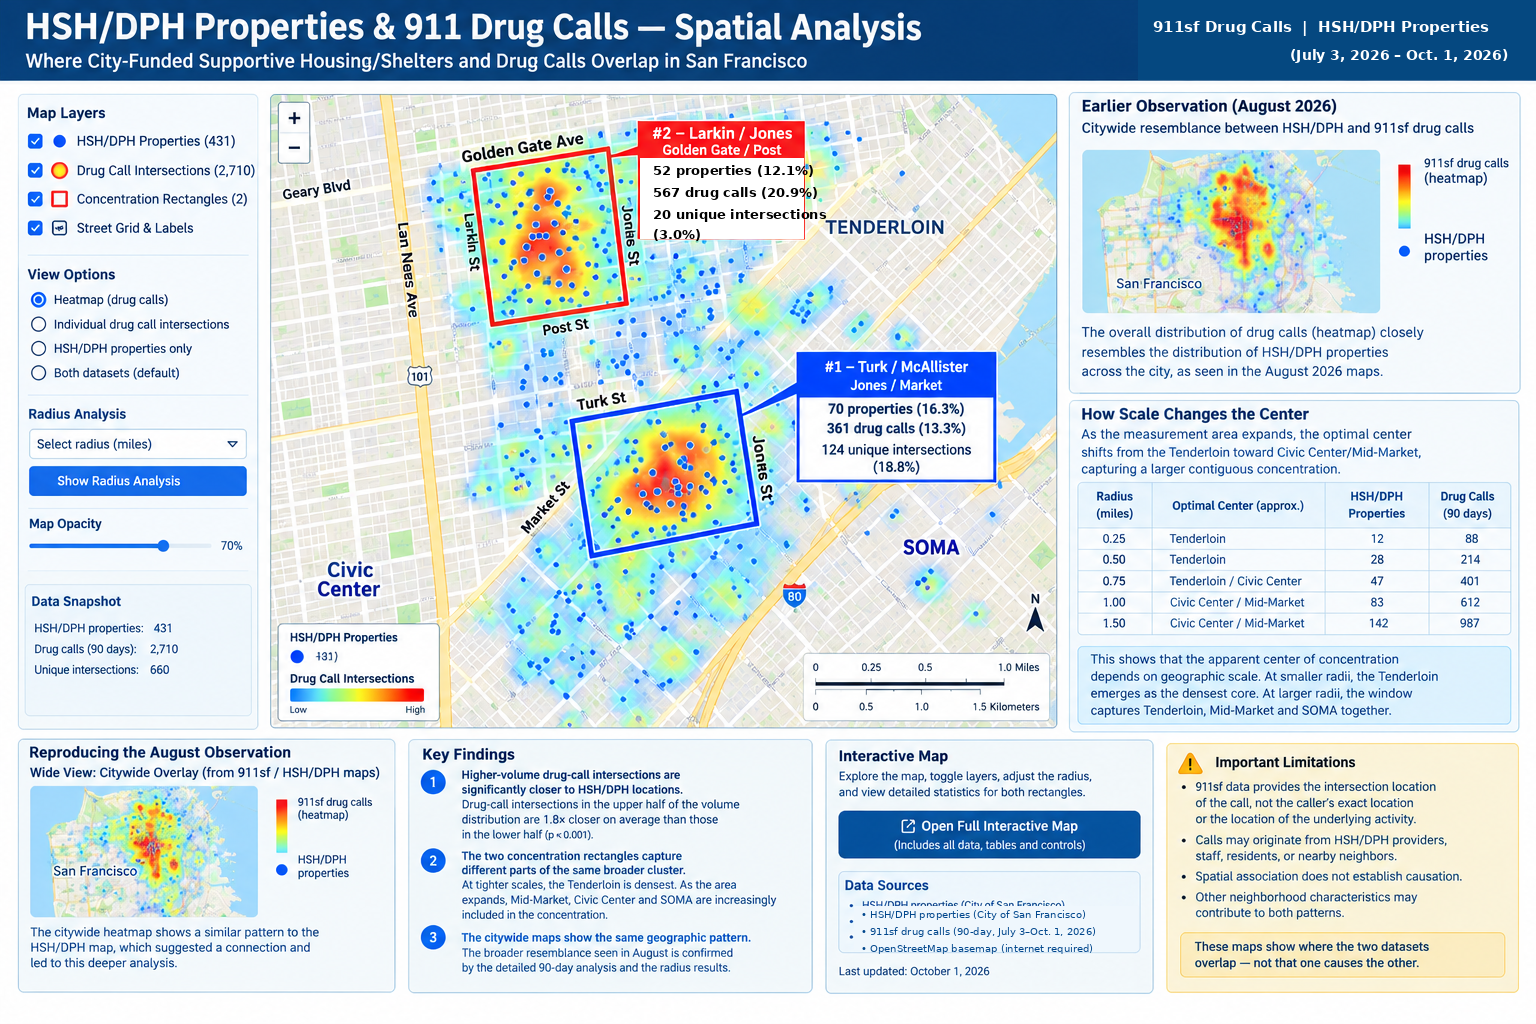
| New map 10.1.26
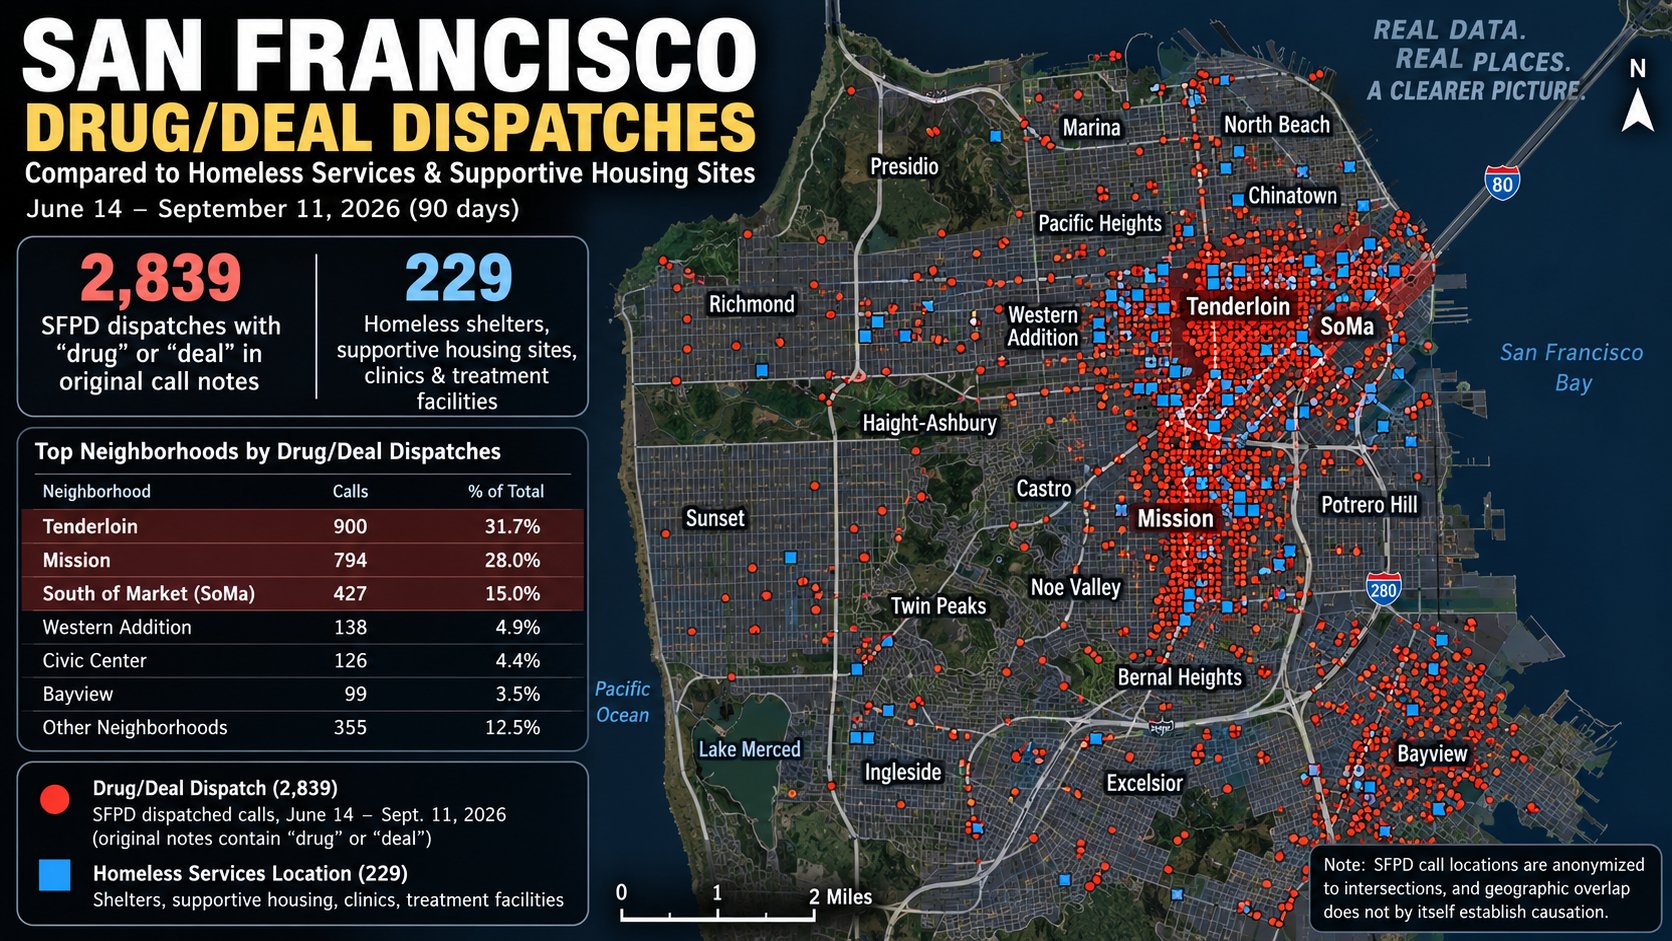
10.1.26 new map comparing last 90 days drug calls with known HSH/DPH properties
|
| 391 Ellis visual audit
9.30.26 January–August 2026 visual audit of SFPD arrest records listing 391 Ellis, including handwriting review, source scans and monthly trends. |
| Current master map
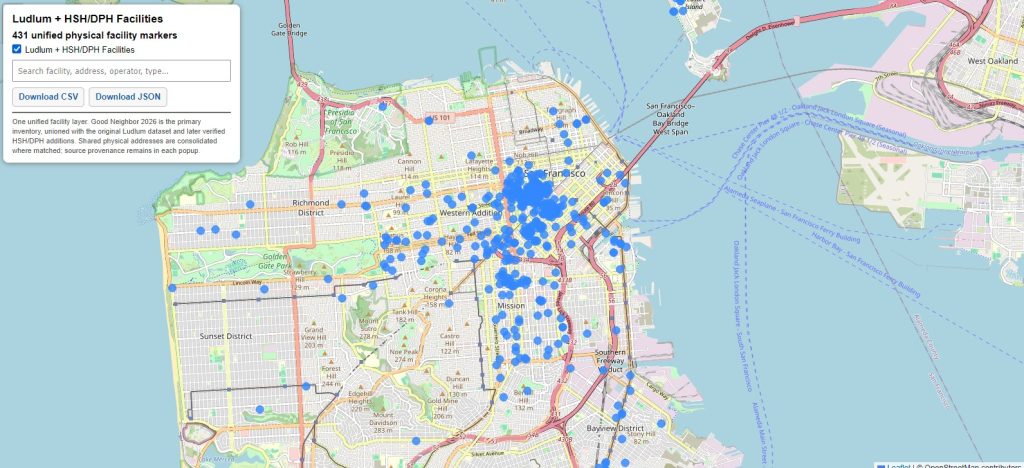
9.27.26 431 HSH/DPH facilities in one unified layer with downloadable data. |
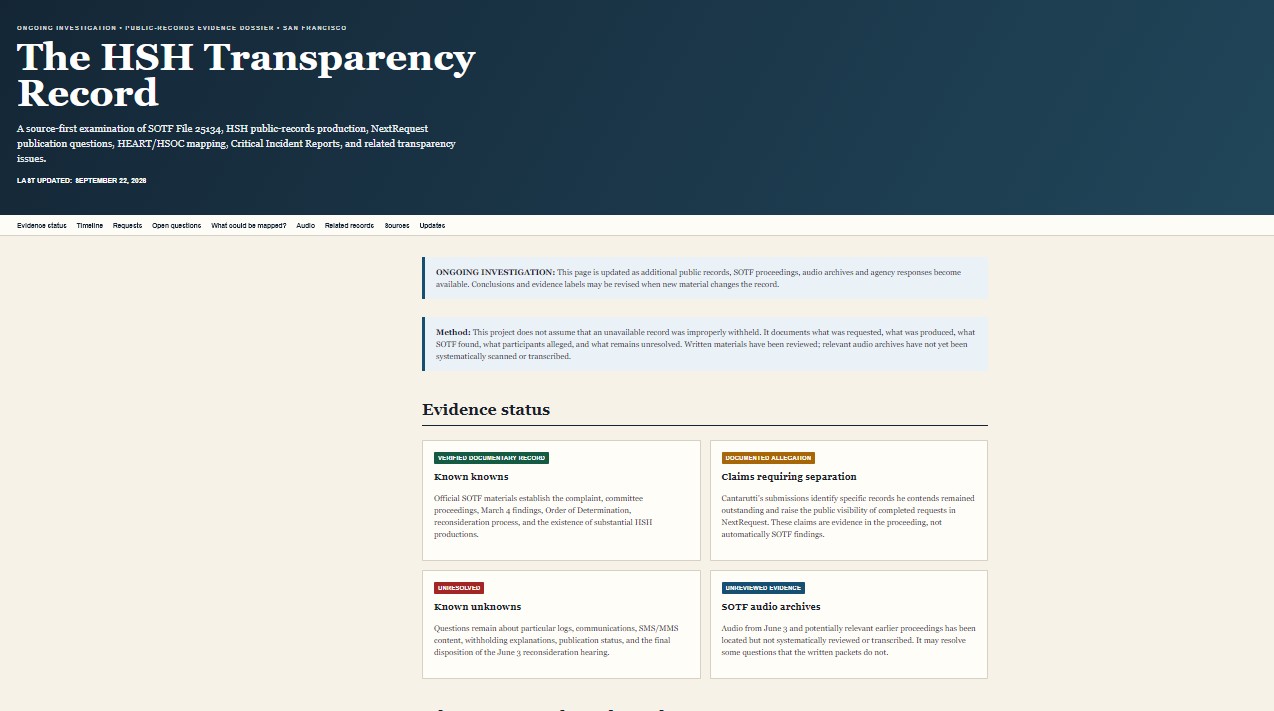
| HSH transparency investigations
9.22.26 Ongoing HSH transparency investigations. |
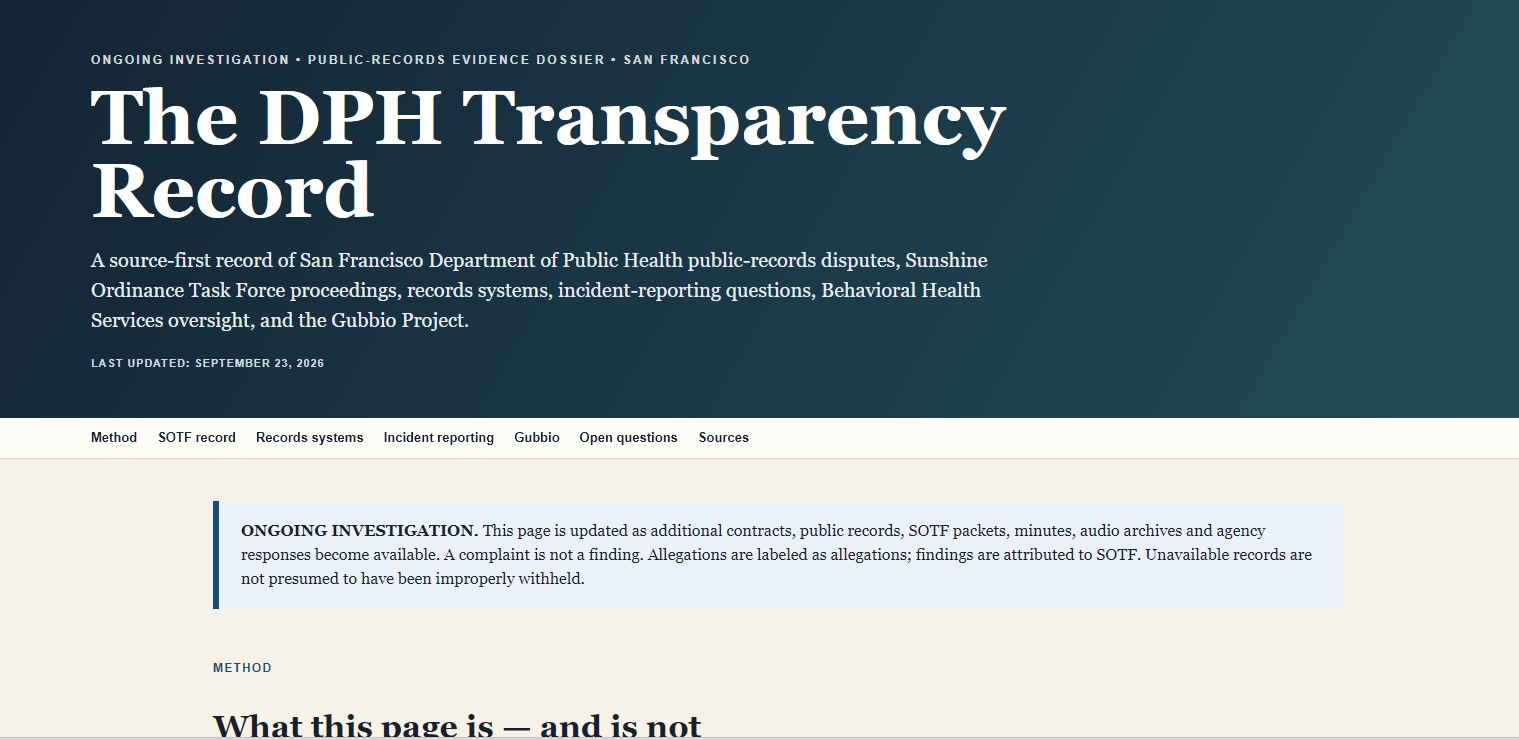
| DPH transparency record
9.23.26 Dedicated DPH transparency record. |
Browse by topic
Latest / master maps Police & drug-incident analysis Street teams / CAD / 311 / RESET HSH / DPH facilities & harm reduction Transparency records EMS / fire / calls near HSH sites
Latest / master maps
| 391 Ellis visual audit
9.30.26 January–August 2026 visual audit of SFPD arrest records listing 391 Ellis, including handwriting review, source scans and monthly trends. |
|
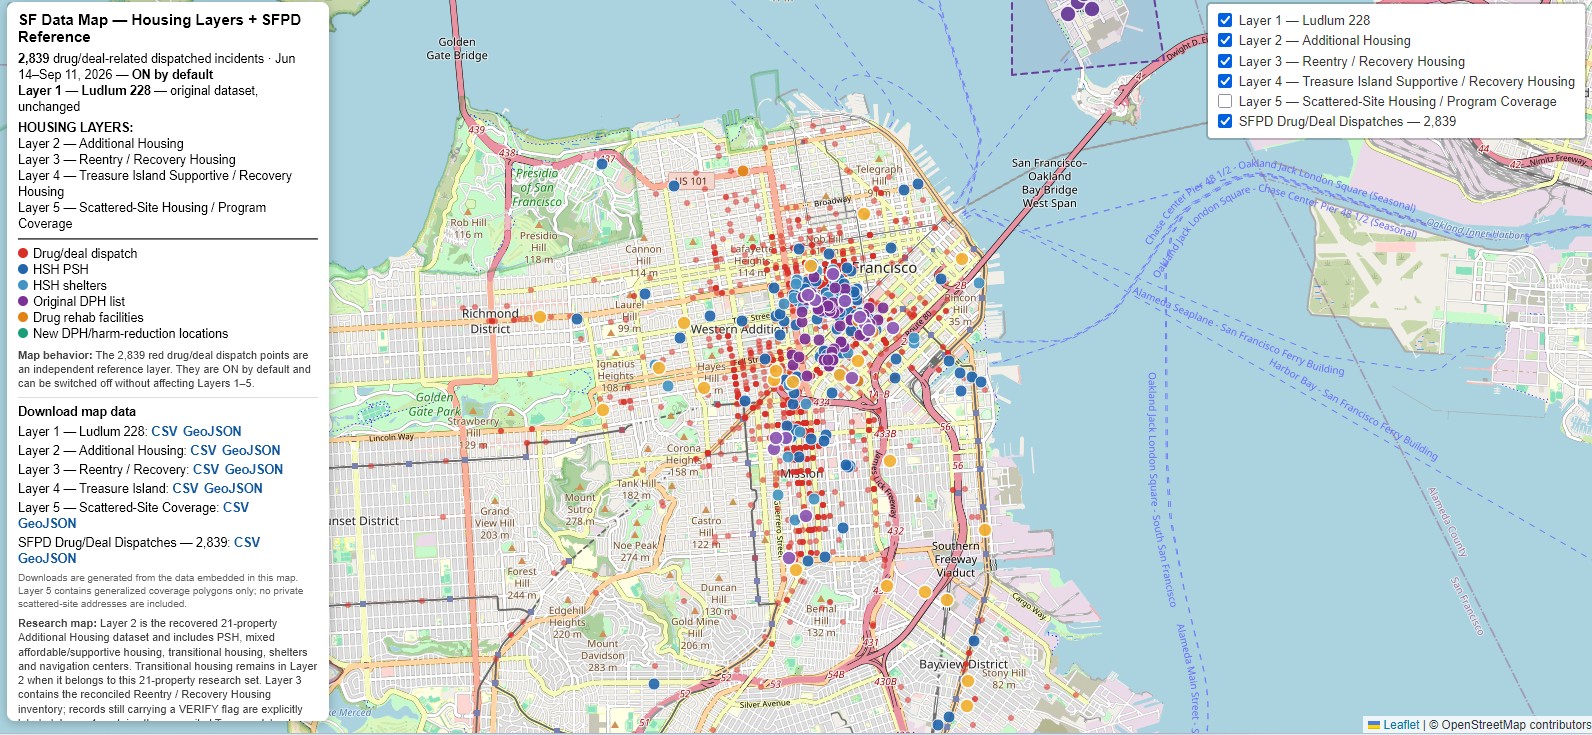
Unified HSH / DPH master map 9.27.26 Master map expanded from 240 to 431 HSH/DPH facilities in one layer, with downloadable data. |
|
Six-layer master map V4 9.17.26 Nearly finalized six-layer version. |
|
Six-toggle master map 9.16.26 Nearly finalized version with downloadable data links. |
Police & drug-incident analysis
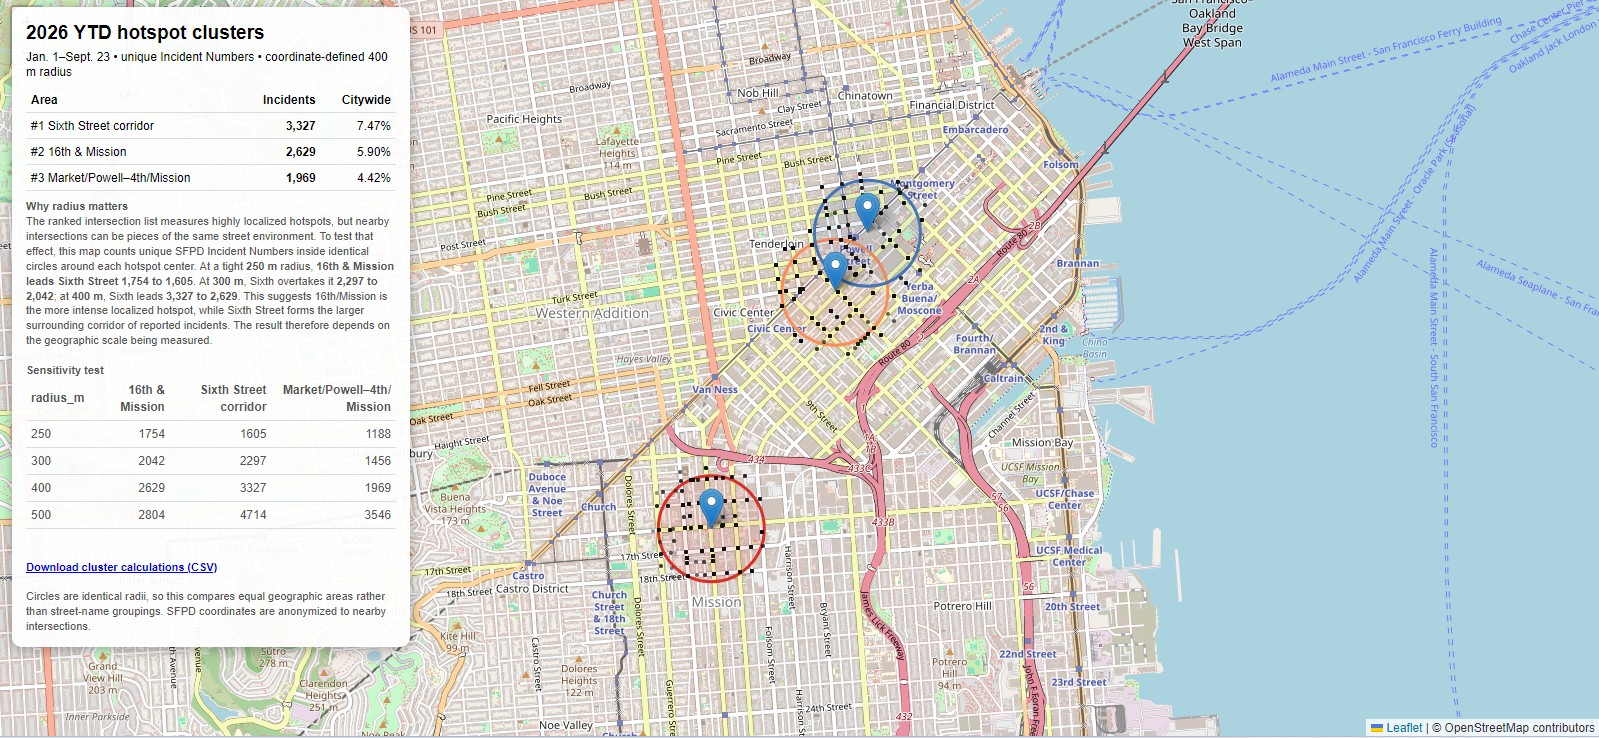
| Revised top-three incident clusters
9.25.26 Revised hotspot map with added explanation that the 4th & Market / Powell / Union Square area is mostly retail theft. |
|
2026 hotspot cluster map 9.25.26 2026 highest-crime hotspots with reference to 2010 hotspots and a cluster-radius comparison. |
|
2026 highest incident locations 9.25.26 Map of the highest incident locations in 2026 YTD. |
|
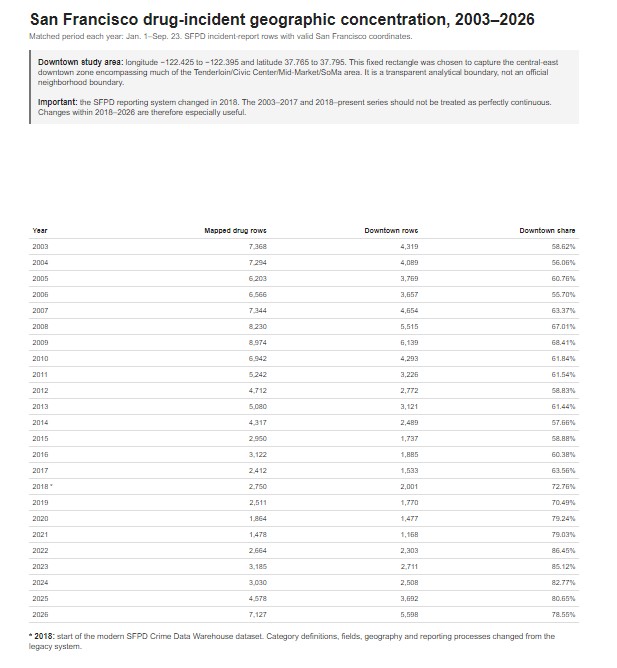
Drug-incident geographic concentration, 2003–2026 9.23.26 San Francisco drug-incident geographic concentration analysis. |
| Drug incident progression map, 2003–2026
9.23.26 Accompanying map showing drug-incident progression with chart. |
|
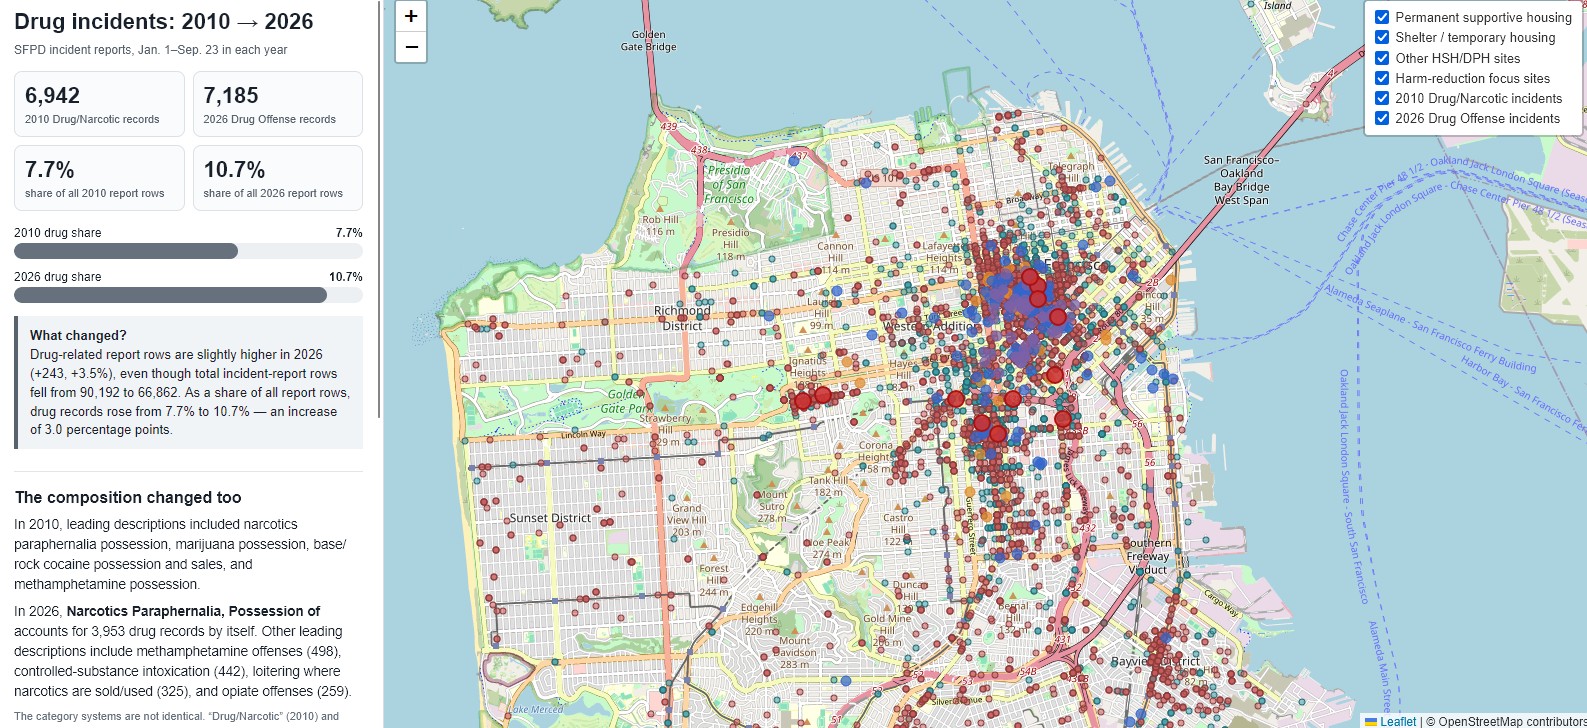
2010 vs. 2026 drug incidents 9.23.26 Police incident report comparison showing where drug incidents occurred in 2010 and 2026. |

Street teams / CAD / 311 / RESET
|
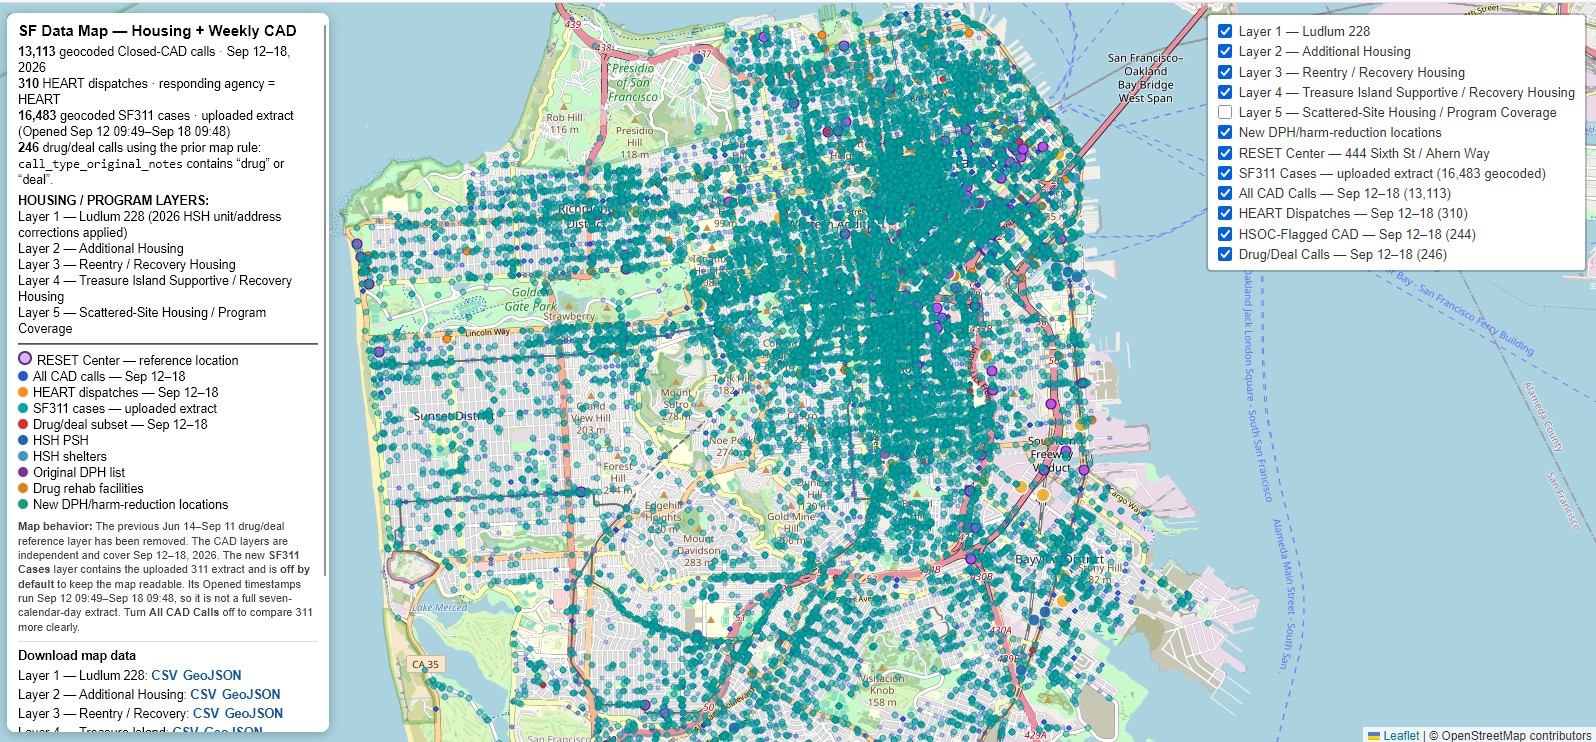
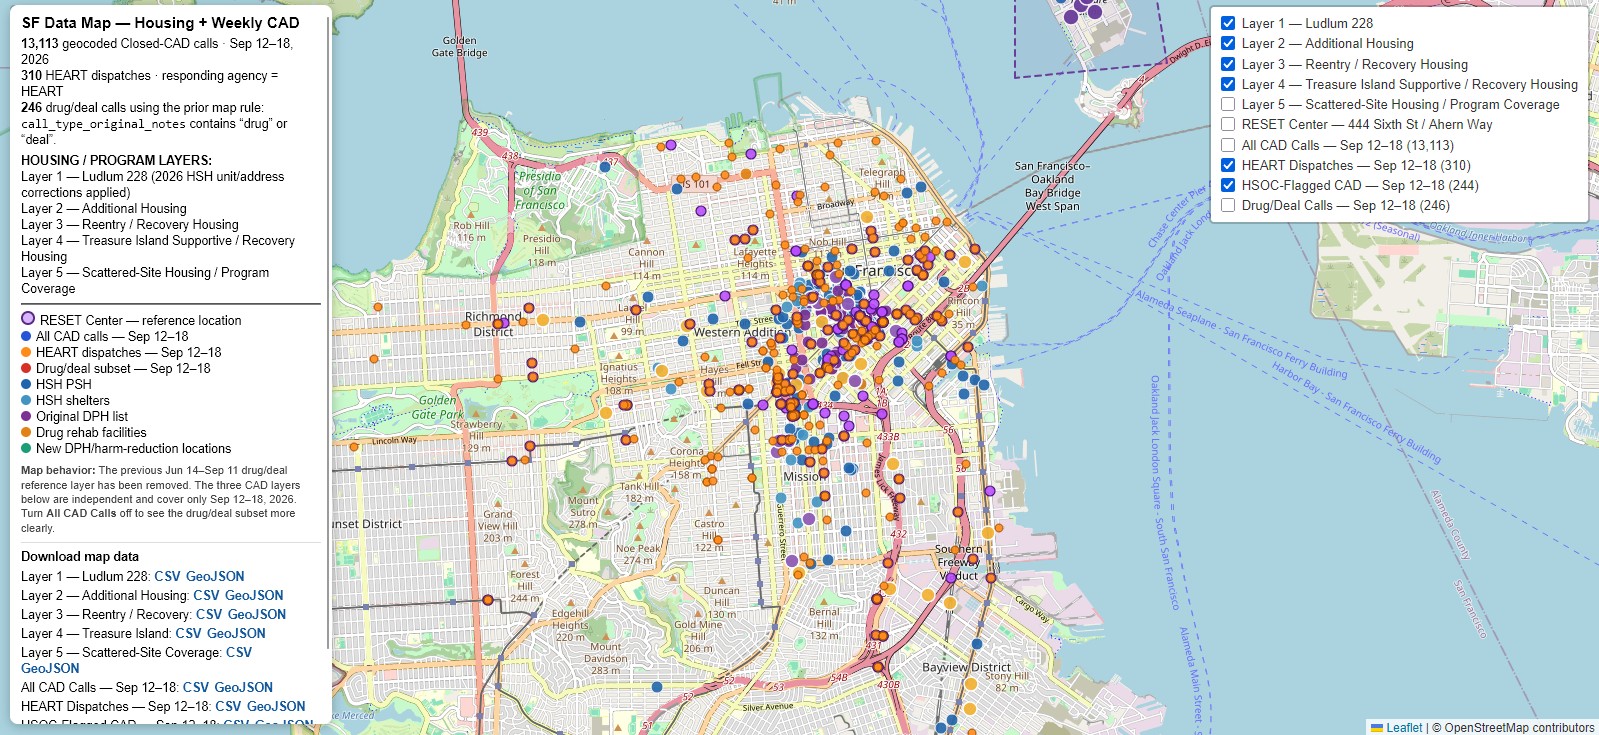
Weekly CAD / HEART / HSOC / 311 / RESET 9.23.26 311 layer added for the week of September 12–18, 2026. |
|
HSOC and HEART street teams 9.21.26 Map distinguishing HSOC and HEART street teams. |
| Corrected housing layer
9.21.26 Minor corrections including the Graystone at 66 Geary and other misplaced sites. |
| RESET Center at 444 6th
9.21.26 RESET Center added at 444 6th Street. |
|
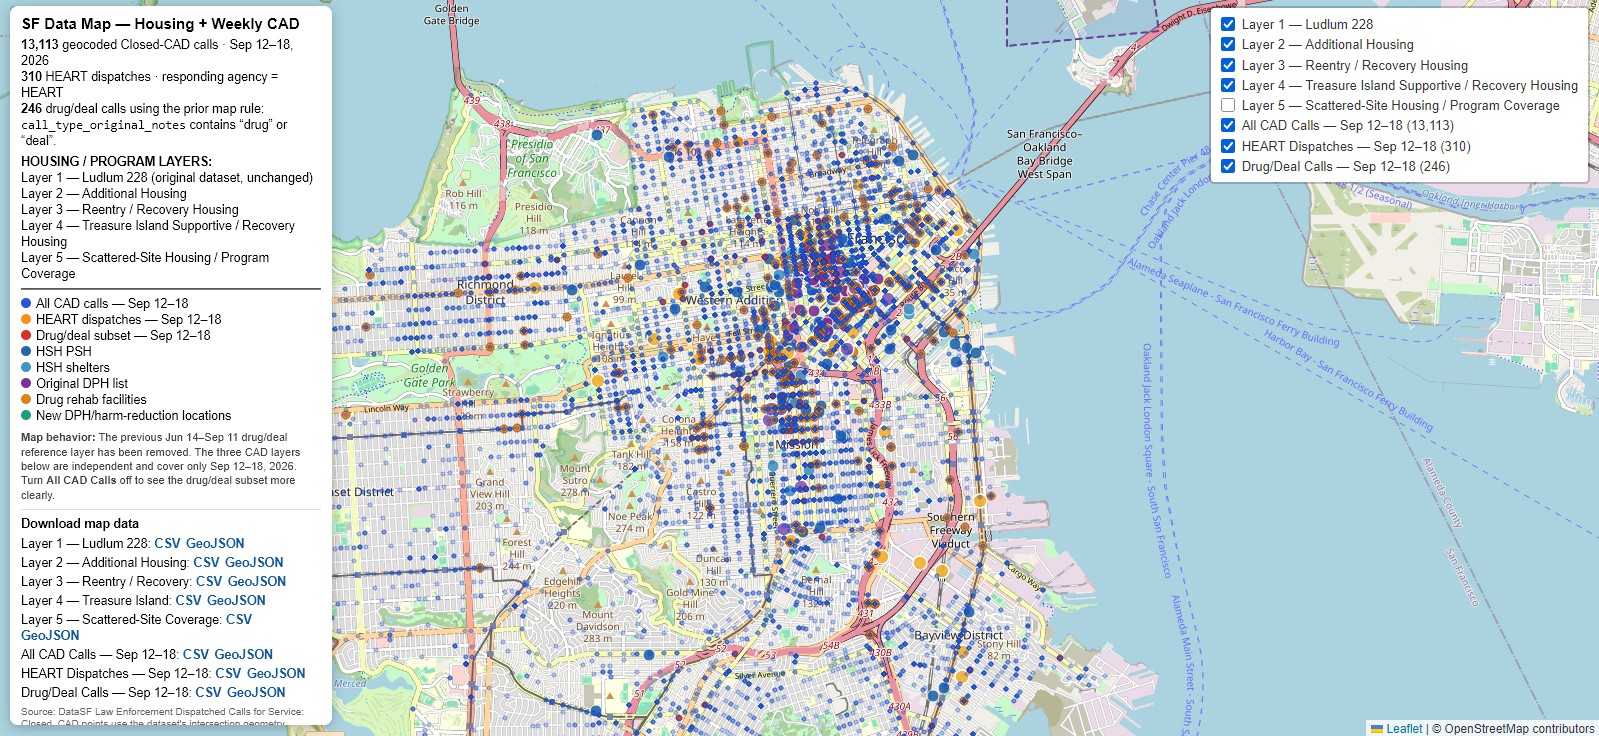
Weekly CAD with HEART 9.20.26 Three-layer map with original housing layer, all CAD calls, and HEART/street-team/drug-related calls. |
HSH / DPH facilities & harm reduction
|
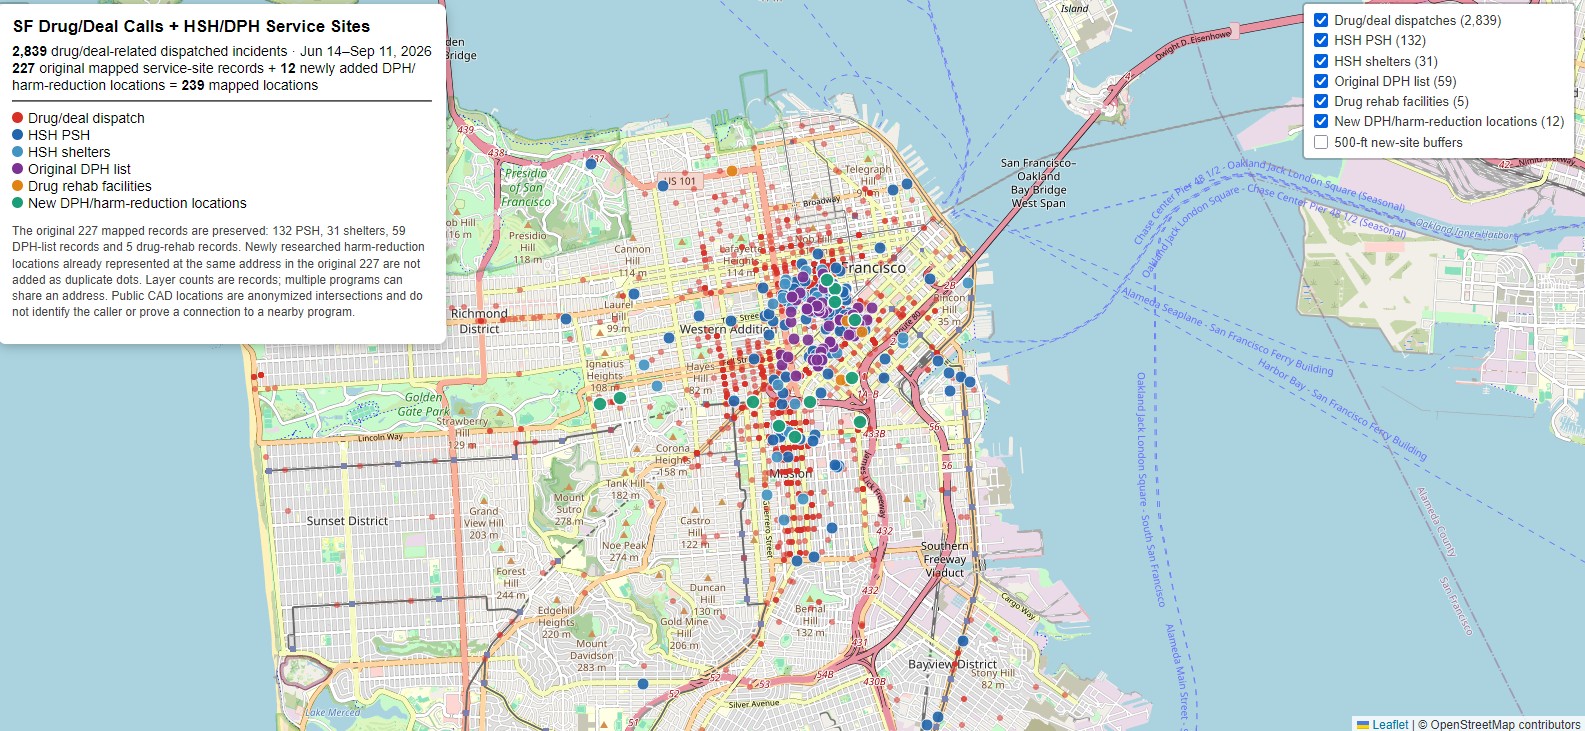
228 HSH / DPH / harm-reduction sites 9.15.26 Updated to 228 sites, including the Caldrake, with call counts. |
| 227-site HSH / DPH / harm-reduction map
9.15.26 Earlier 227-site version. |
| 227-site map with call counts
9.15.26 Earlier 227-site version upgraded with call counts. |
Transparency records
|
DPH transparency record 9.23.26 Dedicated DPH transparency record, tracked separately from HSH. |
|
HSH transparency investigations 9.22.26 Dedicated page for ongoing HSH transparency investigations. |
EMS / fire / calls near HSH sites
|
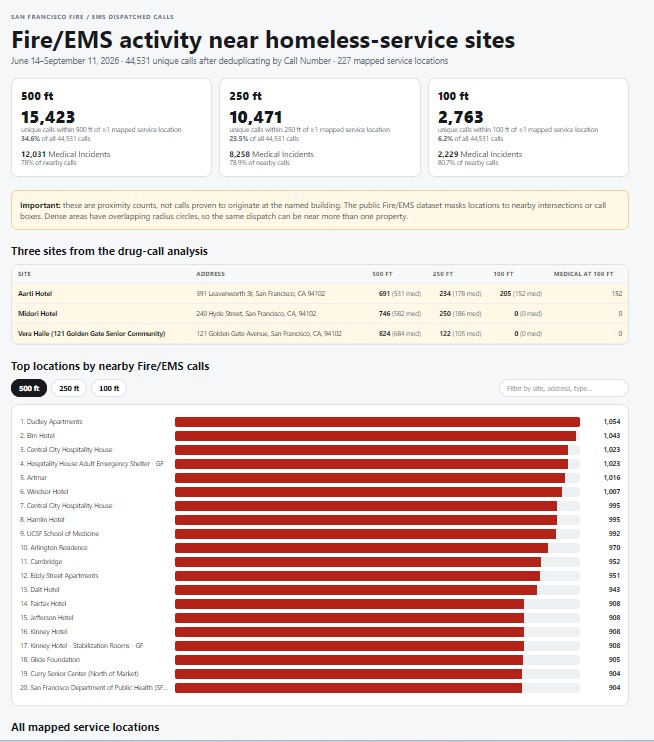
Fire & EMS dispatches near HSH sites 9.14.26 EMS and fire dispatches from June 14 through September 14, 2026. |
|
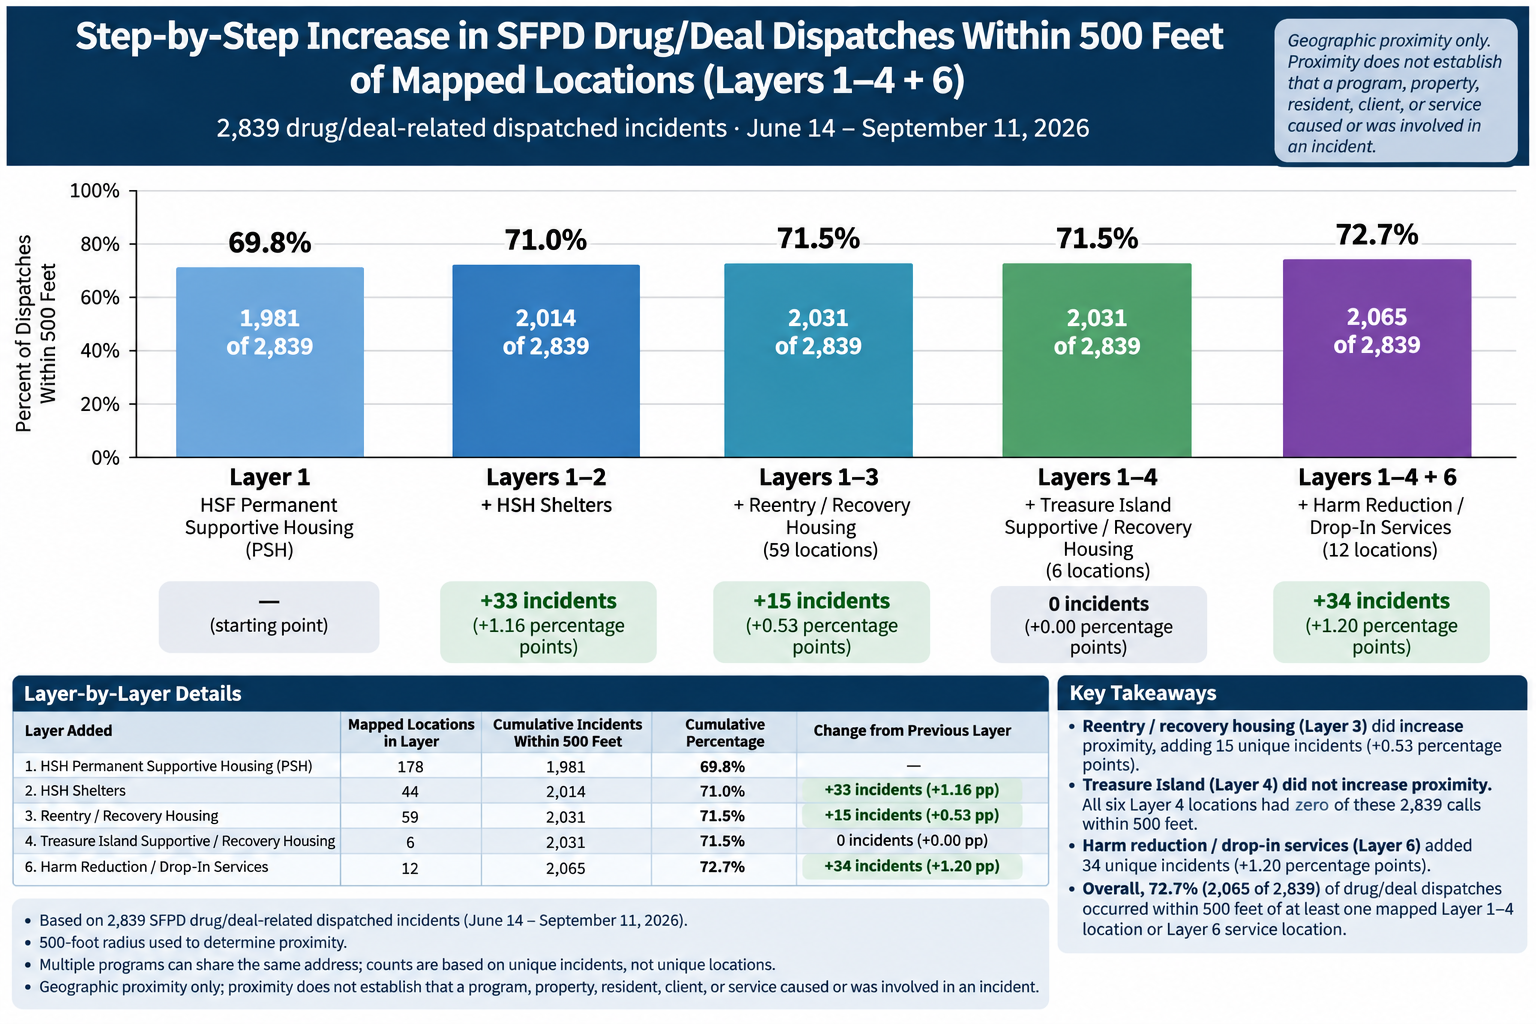
Drug-related calls within 500 ft of HSH sites 9.14.26 Drug-related calls within 500 feet of an HSH site, June 14 through September 14, 2026. |
About this index: Older versions are retained where they document the development of a map or dataset. Newer entries generally supersede earlier versions unless otherwise noted.